"Steve really believes that wind angles tend to run higher than lower. You can go to the Hed site and there’s a wind angle calculator. Here’s the rider and his direction and his speed, here’s the wind and its direction and its speed, and you can calculate that instantaneous wind angle. Now, to me, what’s that given you, that’s how you determine the max wind angle on that day, and there’s a simple hand calculation for that, the inverse tangent of the wind speed over the rider speed.
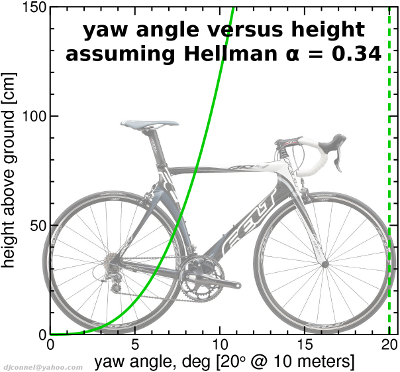
So if you’re riding at 20mph, and you have a perpendicular wind speed of 10mph, that yaw angle is 26 degrees. So the way he looked at it is to say, ’10mph is a common wind, 20mph is a common rider speed, so 26 is the wind angle where we need to work’. The way we worked at it, and this is based off a headtube mounted yaw probe that we built 6 or 7 years ago combined with mathematical modeling, was to say that’s the case when the wind is exactly perpendicular to you, but the road turns, the rider turns, the wind changes, the wind speed at the ground isn’t necessarily the same as where it’s higher, so there is so much more to the story than the 26 degrees..
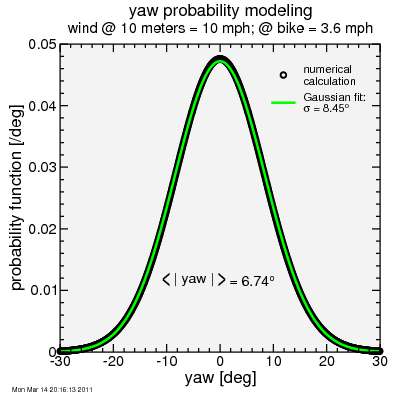
You talk to the weather service and they’ll tell you that average wind condition at any given time during the day is about 8mph in some direction. Well, that’s on a weather service pole, a 3 meter pole. So you’re probably a touch slower at the ground. But even at 8 or 10mph, how often are you riding an out and back where the wind is perfectly perpendicular to you? So we started to determine true wind angle probability of occurrence. What you find in most circumstances is you get a bell curve with zero and max wind angle at the two ends. (Actually the zipp model is two bell curves running from –peak angle to +peak angle with 0 in the middle, and 2 small bell curves, but for simplicity is depicted as just being 0-peak angle and a single curve). In the more modern era we do this with GPS where we can plot actual rider speed and direction and overlay the wind data from the weather service…this allows us to plot the exact distribution of wind angles, and we continue to find that the data matches the original model we discussed in our white paper on this back in 2002-2003.
So back to Hed. He’s in the camp saying 26 degrees, and we say 26 is the max, but if I run that and plot the curve, 13 is the most likely, it’s the highest probability. So that’s where we really diverge. What we found, and we backed it up with this headtube mounted probe that we rode the heck out of and collected the data for months, real world wind angle probability falls between 7 and 15 degrees. If you’re slower it runs higher and vice versa. It’s very rare that you’re going to have a most likely wind angle of 20 or higher, ’cause that means your peak wind angle is going to be 40 or more, and to get there you either have to be going really slow, or have really ridiculous wind speeds, at which point most people are going to opt for shallow wheels.
So the way Steve calculates really works favorably to the 3 spoke wheel, ’cause that wheel is pretty average ’til 20 degrees, then it’s super fast between 20 and 35. So that works really well to say, ‘Hey, you’re an age group triathlete, run this wind angle, you’re going to be in the 20’s, and this wheel going to be the fastest in the 20’s.’ The way I look at that, looking at the wind angle probability, that same age grouper that he’s considering at 26 degree yaw, we are considering, by the first deviation, is going to be roughly between 9 and 17 degrees. And that’s a whole other story, because between 9 and 17 degrees there’s a whole host of wheels that are a lot faster. So, with our rim shapes and our wind tunnel testing, what we’ve done is optimized and designed our rims to work at the angles you are most likely to experience on the road in the real world.
Designing a rim is like designing an aircraft wing, right? With enough time and enough money we can make it optimal wherever we choose. And we believe this more reality based statistical probability model of wind angle, we really shoot to be peak efficiency between 10 and 15 degrees, and have your peak minimum drag in that range. And I think the reality, the GPS data, the teams testing it, the power measurements off the bike, time seems to be proving our picture of wind angle probability to be more correct. And I would say the market is rewarding that, the pro teams are definitely rewarding that. Six teams in the Tour were using Zipp products this year yet Zipp lists only 3 official team relationships. We work with the teams that are doing the testing, that are interested in technology, the ones for whom the data and expertise we bring is worth more than the money other companies can offer."
http://nyvelocity.com/articles/equipmen ... -poertner/